Gain an unfair investing advantage
+90% of our stock picks have been sold with a profit.
Only invest in high quality, profitable companies with a large margin of safety!
For $29/wk
Algorithmic approach
Our algorithms identify high quality public companies with a high margin of safety, similar to methods used by Benjamin Graham
+90% Win Ratio
To date +90% of our stock buy/sell signals have been sold with a profit.
7-day money back guarantee
If you don’t absolutely love our service after signing up. No worries, we’ll give your money back - No questions asked.
How we pick winning stocks
Instead of searching for meaningless patterns in stock prices & charts we evaluate the actual businesses behind the ticker.
Our algorithms analyze and evaluate businesses in 100's of different ways. Each method provides a score based on factors like value risk growth stewardship & many more. Which is then used to give you our best stock pick every week.
You're in full control
Unlike a financial advisor or fund we don't need access to your accounts. Every step of the way you are in full control of your own investments. Just like you should be!
Join our community
Stay up to date on our stock tips and engage with our community of value investors through our Discord Chat.
Performance guarantee
We're the only stock picking service that back up our numbers with a performance guarantee. We beat the S&P500 or your money back!
Don't believe us? - We'll prove it!
Receive emails with actual results of our investment signals. (good or bad)
*We won't spam you & we'll never share your personal details with third parties.
The Stock Tips
Here’s an example what you’ll see in the dashboard every week.
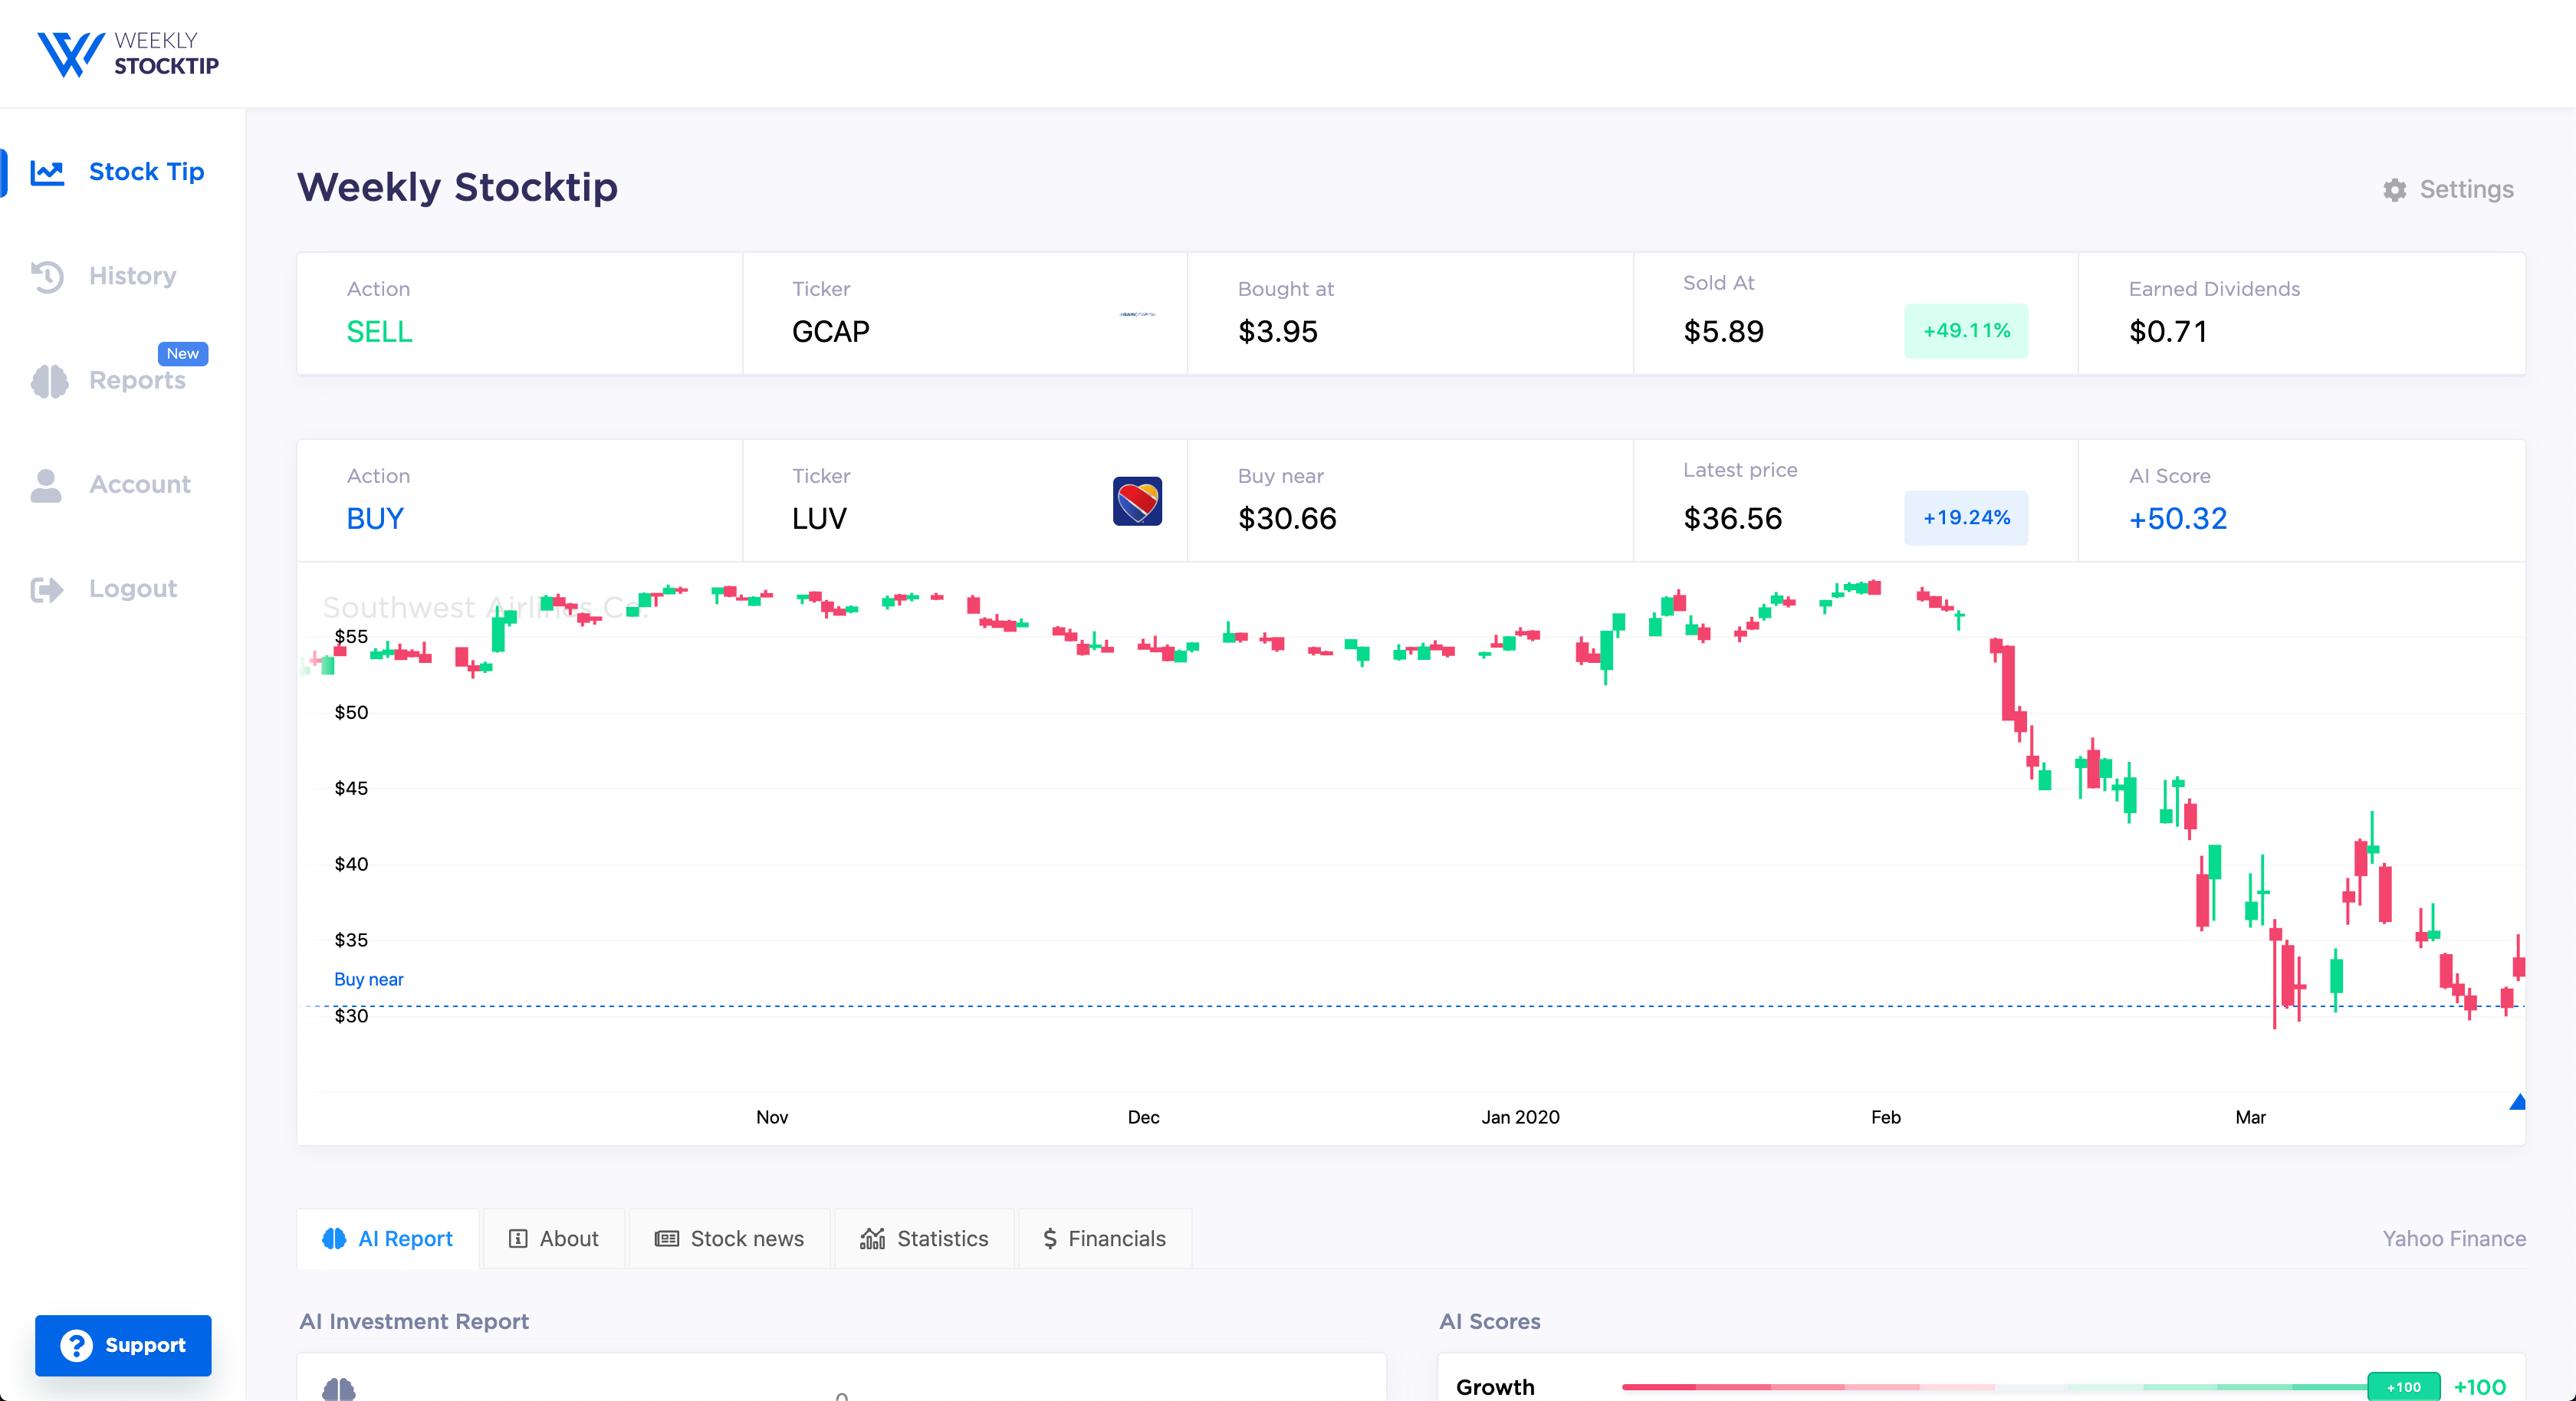
Latest sell signals
Here's our 10 latest sell signals (updated monthly)
Loading...
| Stock sold | Bought at | Sold at | Return |
|---|
*Past results are not necessarily indicative of future returns. (Our lawyer said we had to write this)
Learn more about how we beat the market.
Performance
How $25,000 invested with Weekly Stocktip in 1970 would have multiplied.
Loading chart
*Historical numbers are based on backtested data. Since our 2009 launch we have observed similar results in real-time.
We Outperform the S&P 500 or Your Money Back!
We're the only signal service that guarantee our performance!
*If for any reason we don't outperform the S&P 500 index, we will give you a 100% refund, no questions asked.
You must think we're crazy. Guaranteeing performance in the stock market would end any financial advisor's career. But we've consistently outperformed the S&P 500 for over a decade, and we're willing to put our money where our mouth is to prove it.
The AI Score
How we quantify a stock's future performance down to a single number
We've given every stock in the market a score between -100 and +100 that represents it's expected future performance. This number is accumulated by many algorithms combined with an artificial intelligence layer to quantify the following factors:
Risk, Reward, Growth, Value, Profitability, Soundness & Stewardship, which all add up to the overall AI Score.
While the many scientific algorithms that go into creating AI Score are incredibly complex, fortunately it's very easy to test our hypothesis. Running an unbiased simulation where it only invests in stocks within AI Score brackets e.g. [80 - 90]. Now, if the AI Score works, each bracket, should produce a higher return, in a somewhat orderly fashion. If not, you'd get more or less random results.
*AI Score requires at least 7 years of financial data & reports to calculate.
The above chart shows just this experiment tested in a period of 50 years on over 12,000 stocks. You can see if you invested solely in stocks with an AI Score between 80-90 the likely long-term outcome is a return of ~27%.
Nothing can guarantee a certain return for a single stock, but consistently using high AI scores means you'll be buying quality stocks when they are on sale, in businesses likely to grow and improve over time. You'll also more often than not avoid businesses that are awful, expensive, badly run, produces subpar returns, or are extremely risky, to name just a few advantages. In short It decreases risk and increases return.
Don't invest without it!
Statistics & Risk
Most investment systems get this wrong
Time for real talk! No single investment is 100% risk free. But after over a decade of hard work, we've come pretty close with a +90% win ratio. But this of course still means that 10.00% of our stock tips were losers.
Win ratios by themselves are however not great at determining risk. You could win 99% of the time and only lose 1% of the time. But if your 99% winners only return +1% in profit and the 1 loser crash by -100%... That's not an attractive investment system!
It's important to examine the average return of a winner, and the average loss of a loser.
- Average return of a winner: +102.37%
- Average loss of a loser: -16.47%
Here you can see our average return of the 90% of winners, are much higher than the average loss of the 10.00% losers. In other words, there's always a chance to lose on a single investment. But investing consistently once a week in the long-term strongly puts the odds in your favour.
There are many other factors to evaluate risk but they are worthless if they are calculated from data without statistical significance. Any investor can make 10 investments using 50 different strategies, one of them will probably have a win rate of +80% simply by chance. We've made sure any concerns about statistical significance are covered, not only running ethical back-tests as far back as 1970 with over 2,500 investments carried out but actively trading this strategy live since 2009 with statistically similar results.
If you've done some research into investment systems you'll likely have heard of other ways to measure risk such as the Sortino Ratio & Gain-to-pain ratio etc. Here's what these look like for Weekly Stocktip
- Gain-to-Pain Ratio: 2.39697
- Sortino Ratio: 7.532204
- IRR Geometric Mean: +48.66%
- IRR Arithmetic Mean: +108.01%
- CAGR +33.41%
- Max Drawdown 36 months: -22.97%
- Max Drawdown 50 years: -47.85%
- Expected return per stock +94.19%
We've written several articles on the subject of risk in investment systems and there's no way to fully answer this question with the nuance it deserves in a single section. For more information about statistics & risk, read our 2008 Research Paper or contact us!
Testimonials
Don't just take our word for it. Here's what our customers have to say
Questions?.. We know you have some
How do you beat the stock market?
How long is the holding period?
Do you have a money-back guarantee?
We've told you what we can do...
It might be the perfect time do stop reading and do some clicking instead!
Don’t forget we have a 7-day money back guarantee if you regret it (but you won’t!).
No lock-in contract, cancel anytime